- School District of Beloit
- 7th Grade - Math
7th Grade - Math
-
The School District of Beloit selected a high-quality math curriculum aligned to WI state standards that incorporates research-based instructional strategies to support all students in their mathematical learning. The goal of the math program is to prepare our students for their future, which could be very different from the world we live in today. As a result, we make an effort to establish a solid foundation in problem solving, conceptual comprehension, procedural fluency, and applying math to real-world situations. At all grade-levels, lessons build on a student’s prior math knowledge to help prepare them for future math learning.
7th Grade Units
-
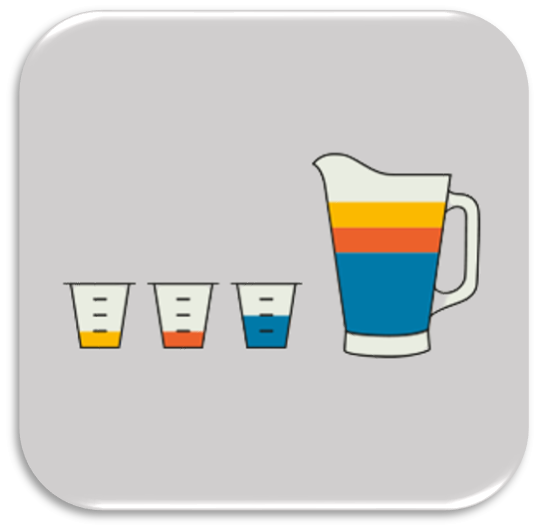
Ratios and Proportional Relationships
Students apply multiplicative relationships and ratio reasoning to understand proportional relationships and identify them in tables, graphs, equations, and written descriptions. They compare proportional relationships and determine when constant rates indicate proportional relationships. Students connect the constant of proportionality to scale factor, and they use proportionality to identify when figures are truly enlargements or reductions of original figures.
-
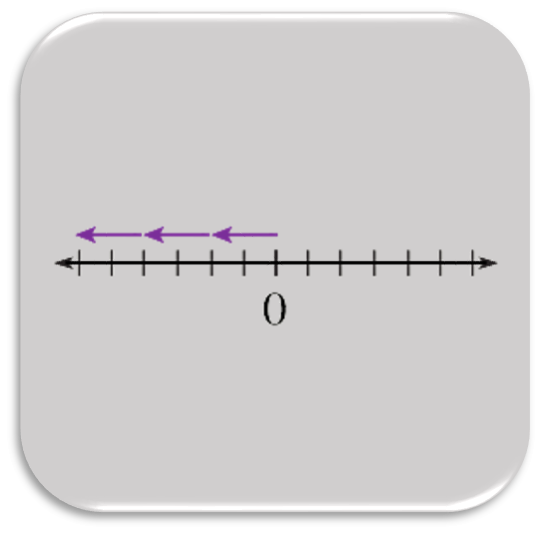
Operations with Rational Numbers
Students extend their knowledge of rational numbers and use patterns and properties of operations to make sense of rational and negative number addition, subtraction, multiplication, and division. Students also use the properties of operations, as well as decomposition and order of operations, to evaluate numerical expressions containing rational numbers.
-
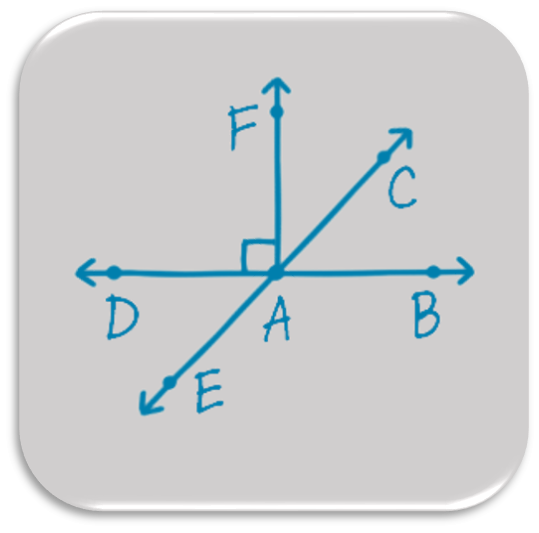
Expressions, Equations, and Inequalities
Students move from doing familiar work with numerical expressions to determining when algebraic expressions are equivalent. They apply properties of operations—namely the distributive property—as well as the use of tabular models to multiply and factor expressions with rational and negative numbers. Students explore unknown angle measurement contexts to solve equations and move to a new strategy for solving equations: if-then moves. Students use if-then moves or the structure of the equation to solve equations in the forms
-
Geometry
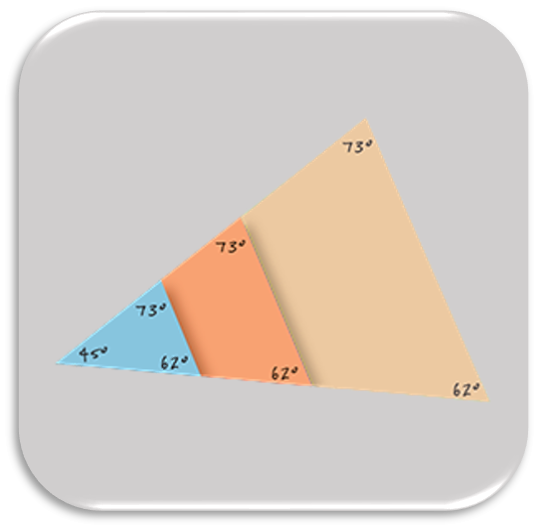
Students construct geometric figures by sketching or by using tools and technology. They construct triangles given certain conditions and determine whether the triangles are identical. They discover that at least three conditions are needed to guarantee a unique triangle, but that three angle measures alone do not guarantee a unique triangle. Students explore the proportional relationship between the circumference of a circle and its diameter and formally use pi to determine the circumference of a circle. They use circumference to aid in generalizing the formula for the area of a circle, and determine the area of circles, semicircles and quarter-circles. Students use strategies to find the area of composite figures and determine an efficient strategy to calculate the surface area of three-dimensional solids. They explore the cross sections of three-dimensional solids and use the information to understand how to compose or decompose a three-dimensional solid to calculate its volume more efficiently.
-

Percent and Applications of Percent
Students realize the equation a/b = c/d
-

Probability and Populations
Students bridge their understanding of proportional relationships to calculating and interpreting probabilities. They find empirical probabilities and compute theoretical probabilities. Students estimate probabilities and observe that the more trials they conduct, the closer an empirical probability should be to the theoretical probability. They further estimate when they learn the importance of random sampling and when they estimate a population proportion by using categorical data from a random sample. Students end the module by comparing populations with similar variability.
By the end of 7th Grade, students will...
-
- identify proportional relationships in tables, graphs, equations, and written descriptions.
- understand when constant rates indicate proportional relationships.
- learn that the constant of proportionality goes by another name, scale factor, when applied to scale drawings.
- produce scale drawings by using the scale factor and then compare the area of a figure to the area of its scale drawing.
- use number lines, decomposition, and patterns to evaluate addition expressions.
- represent subtraction expressions on a number line to identify that subtracting is the same as adding the opposite.
- use properties of operations, decomposition, and order of operations to evaluate numerical expressions containing rational numbers.
- participate in activities and puzzles to fluently solve equations.
- graph boundary numbers and test numbers to determine the correct region on the number line to shade.
- use the formula to find the area of circles, semicircles, and quarter-circles.
- sketch geometric shapes freehand and construct them using tools and technology.
- determine the radius or diameter of a circle by studying the circumference.
- determine that at least three conditions must be met to guarantee a unique triangle, but that three angle measures alone do not guarantee a unique triangle.
- analyze different strategies for solving a percent problem and formally use proportions to find solutions to percent problems.
- identify the part, whole, and percent to determine unknown values.
- extend their knowledge of proportionality by solving problems involving simple interest.
- use proportional reasoning to solve percent problems in the context of commissions, discounts, fees, and taxes.
- learn the importance of random sampling when using sample statistics to estimate population characteristics.
- learn how to estimate a population proportion by using categorical data from a random sample.
- compute theoretical probabilities by using a variety of methods, including collecting data and using tree diagrams.
- use random samples generated with a random number table to estimate a population mean by using numerical data.


